This website was created as an assignment for Genetics 564 at the University of Wisconsin-Madison
What is a Microarray?
|
Do to the complexity of gene and protein interaction, expression, and regulation, it is often necessary to analyze multiple genes at once to fully understand their relationships. Microarrays are a great tool for doing this and can used to compare gene expression levels between tissue types, over a period of time, or after being exposed to different conditions. To perform a microarray, researchers must obtain mRNA transcripts from a sample to be used as a template to create cDNAs. During this reverse transcription, florescent tags are added to each strand of cDNA and then washed over a microarray slide that contains a series of nucleotide probes. cDNAs will hybridize to specific probes on the slide that are complementary to their sequence.
|
|
A computer then scans the slide and measures the florescent intensity of each probe site that corresponds to a particular gene. The higher expression level of a gene results in a more intense florescence at its particular probe site. This process makes it easy to quickly quantify all genes being expressed at the same time [1].
RYR2 and Gene Expression Omnibus Profiles
Gene Expression Omnibus (GEO) is a database that has complied experimental data produced from microarrays and other high-throughput genomic experiments. GEO creates profiles for each gene by compiling the genomic expression data submitted by researchers and makes it accessible to the public and other scientists to be used for future study of a particular gene [2].
I used GEO to find gene expression profiles for RYR2. One particular profile that can be seen below shows RYR2 expression differences in atria and ventricle tissue of the common rat, a popular model organism for CPVT research. The profile shows that RYR2 is expressed at higher levels in ventricular cells than in atrial cells. This expression difference was seen in all four samples analyzed. To view the complete data-set of all genes from the particular microarray performed click here.
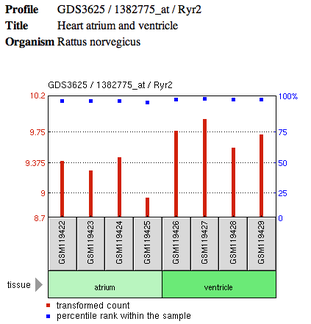
RYR2 expression profile between atria and ventricles [3]
Analysis
By viewing the RYR2 profile generated by GEO, we can conclude that RYR2 is expressed at higher levels in the ventricles of the heart than in the atria[3]. I find this particularly interesting because mutations in RYR2 only produces an arrhythmic phenotype in the ventricles instead of the entire organ. Besides RYR2 expressional differences, this characteristic of CPVT could also suggest that RYR2 has a functional difference between the two regions as well. For further investigation of RYR2 in relation to CPVT, it would be beneficial to perform a microarray like this with a RYR2 mutant before and after exercise. Results could give provide additional insight on how RYR2 expression levels are involved in the disorder.
References:
[1] What is DNA microarray technology?. National Human Genome Research Institute. Accessed April 25, 2014 from http://www.genome.gov/10000533
[2] Gene Expression Omnibus Profiles. Accessed April 25, 2014 from http://www.ncbi.nlm.nih.gov/geo/info/profiles.html
[3] RYR2 GEO Profile. Gene Expression Omnibus. Accessed April 16, 2014 from http://www.ncbi.nlm.nih.gov/geo/tools/profileGraph.cgi?ID=GDS3625:1382088_at
Site created by: Mercede Davis
Email contact: [email protected]
Date last updated: 5/14/14
Genetics 564, University of Wisconsin-Madison
Email contact: [email protected]
Date last updated: 5/14/14
Genetics 564, University of Wisconsin-Madison
